
The rare board defect your cameras flag but can’t reliably identify.
Realistic, already-labelled training photos of exactly that defect — proven on your own boards within two weeks.
Electronics & semiconductors — your number comes from your own boards, never a borrowed benchmark.
Published across 9 datasets and 8 industries — placebo-controlled, measured on real photos. For your parts, the number that counts is the one we produce on your own data — within two weeks.
The missing photos, already labelled.
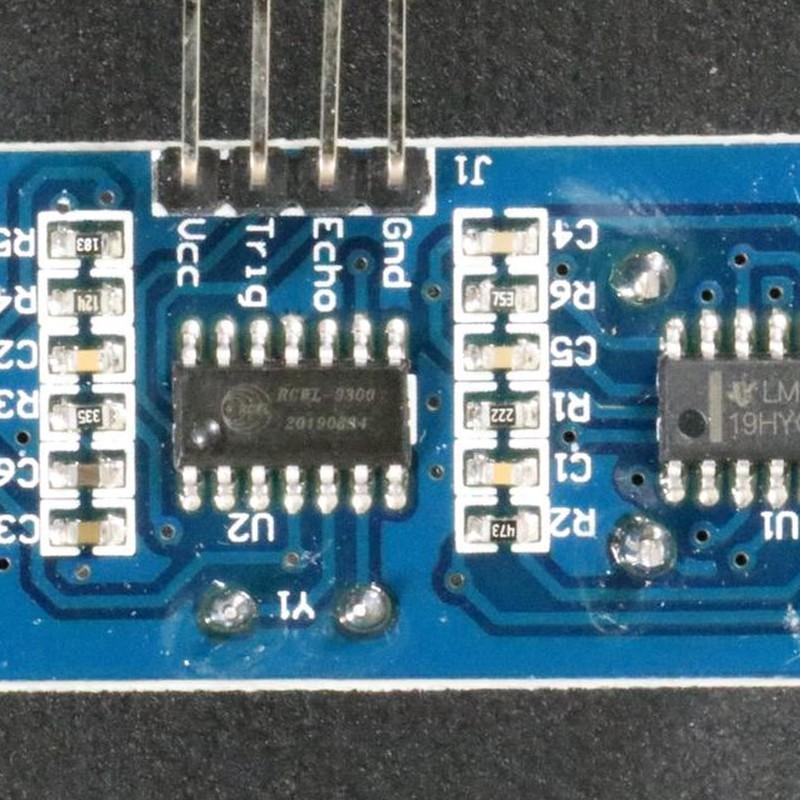
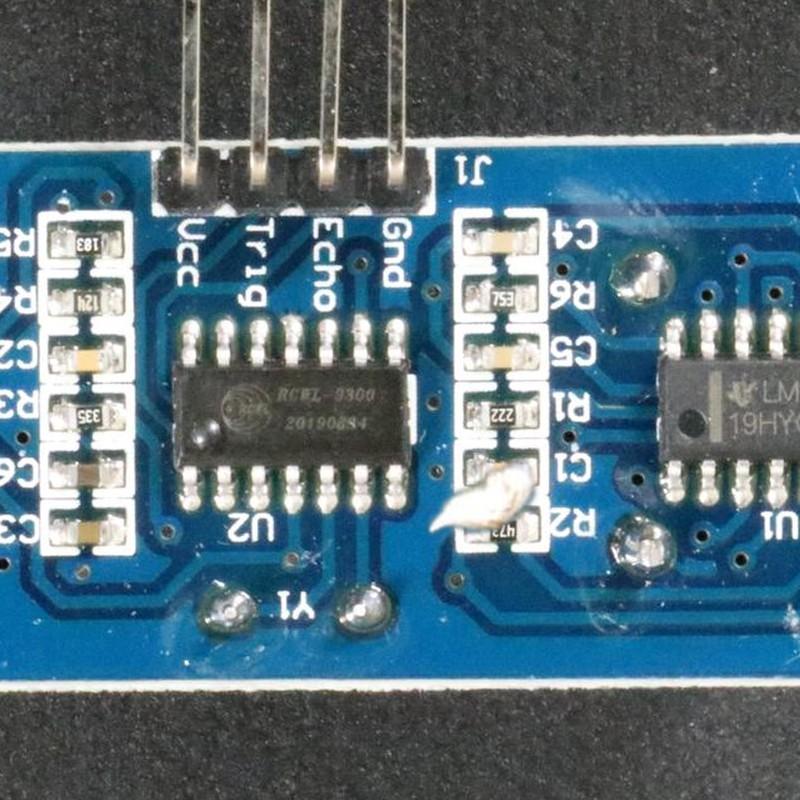
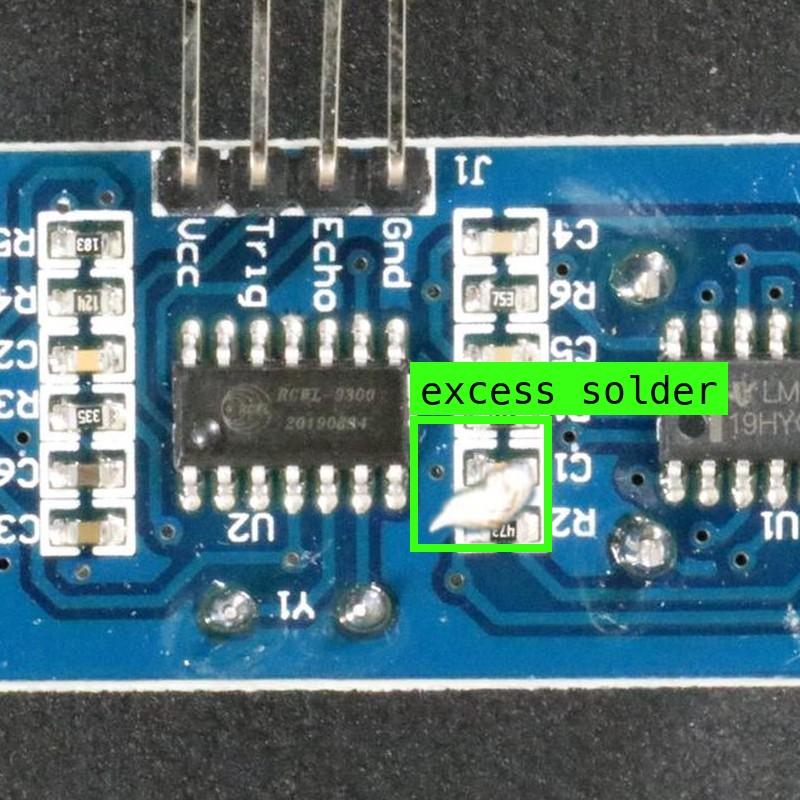
Real, already-labelled training images generated by Synthgen: a clean board (left), the same board with a defect added at true scale, lit to match (middle), and the defect auto-labelled as it's made (right). No hand-annotation.
Source imagery: VisA dataset (Amazon), CC BY 4.0. Synthetic images + labels by Synthgen.
The two-week proof.
Send us the defect your inspection handles worst — the rare one it flags but can’t reliably identify. Within two weeks you have a measured answer: your system today vs. the same system trained with our photos, side by side on your own held-out images — whether synthetic data can move your number, and by how much. You name the accuracy bar before we start, and you pay only if we clear it. No installation, no platform commitment. Your images stay private, isolated, and are never shared or reused.
Pay on results — you set the bar, we clear it or you don’t pay. No free pilots, no free work: just a measured answer.
The old way, retired.
Measured, not promised.
more accuracy on the single hardest defect class — the weakest classes gain the most.
fewer labelled photos to reach the same accuracy — the lift grows as real data shrinks.
max, to a measured answer on your own data — can synthetic data move your number, and by how much.
Results are for one defect class at a time — classification, not a whole-line average — from our published benchmark: 9 datasets, 8 industries, 3 image types (photo, greyscale, X-ray). The biggest published gain, +34.8 pts, came on the weakest class in the benchmark. You set the bar; we measure against it.
Honest in both directions.
Two axes, not one.
Catch-rate alone can lie — a model can “find” more defects simply by flagging good parts. We report defect recall and false calls on your good parts together, so the number is honest in both directions.
Placebo-controlled, always.
Anyone can show a number that flatters. Every result we publish has survived placebo-controlled testing, repeated run after run — if the gain isn’t real, it doesn’t ship.
We’d rather say no.
A 10-minute fit check screens every defect class before we run anything. When a class can’t win, we decline it before you spend a cent — and we have, in writing.
Two weeks, one answer.
You send whatever photos you have of the defect — a handful is enough to start; rare is the point — plus a couple dozen photos of good parts. The good ones teach the model what not to flag.
~1–2 hrs of your engineer
A short fit check. We only run tests we expect to win — and say so if we don’t.
a short call
We generate the photos, label them during generation, and train both versions identically.
nothing from you
A measured answer on your own held-out photos: the lift, side by side — or an honest “this one isn’t a fit.”
30-min readout
A win becomes a paid pilot — a one-month engagement at minimum — then the next defect class, line, or plant.
you decide
Send us your hardest defect.
Two weeks. Your data. Your number.
Private & isolated · your images are never shared or reused · synthgen.co
Published results are per-class classification results (“which defect type” / “defect vs good”) on frozen real-image test sets — ranges, not maxima; never a whole-line average; placebo-controlled and independently repeated. Your number is the one we produce on your own data, against a bar you set before we start.